The Gough Map of Great Britain
Re-digitization of the Gough Map
When the ‘Linguistic Geographies’ project was devised in early 2009 we had in mind using an existing digital scan of the Gough Map undertaken in 2005, which was used in digitizing the map’s features as part an earlier GIS-based ‘Mapping the Realm’ project 1. This previous work had involved digitizing on-screen the map’s various features, separating out each into ‘layers’ within ArcGIS™, comprising ‘places’, ‘rivers’, ‘coastlines’, ‘routes’, ‘mountains and moors’, ‘lakes and loughs’, ‘islands’, ‘historical features’, and ‘cartouches’. The digitized Gough Map resulting from this is shown here.

The Gough Map digitized in 2005 as part of the Mapping the Realm project
Fortuitously, early in 2010 the Bodleian Library undertook a new scan of the manuscript as part of a conservation exercise, giving the project an unexpected yet much better scan with improved resolution. It made sense therefore for ‘Linguistic Geographies’ to use this new map-scan, rather than the first, so the online map-resource makes use of this. However, in the process of matching the GIS-data derived from the 2005 scan we found that the image of the new map-scan differed ever so slightly from that of the old. Why is this important? Well, the digitized map-layers developed as part of the ‘Mapping the Realm’ project now no longer ‘fitted’ over the features as shown by the new scan, as can be seen here.
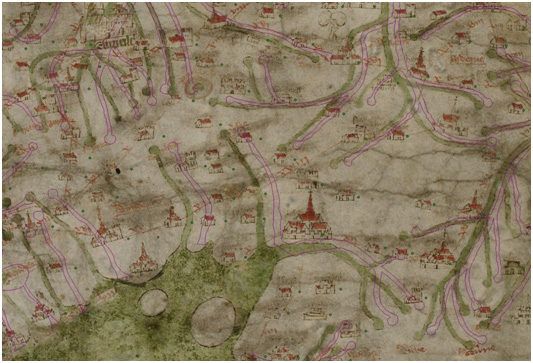
Extract of rivers layer plotted against the 2010 scan of the Gough Map showing mismatch between river vectors (purple lines) and rivers shown on the map (in green)
Although the difference between the two scans is very small, they nevertheless are noticeable, for example in the way the rivers ‘vectors’ (seen above as purple lines) do not match closely the rivers depicted on the 2010 scanned map. So to make use of the ‘vector’ data derived from the ‘Mapping the Realm’ digitization work required some editing to be done, something undertaken within GIS software (ArcGISä) used by the Queen’s University project team. To do this, the new map-image was first ‘georectified’, that is fitted as closely as possible to the GIS data derived from the earlier scan (using a second order polynomial transform within the software), a process based upon selecting a group of key ‘control points’ distributed across the map as a whole. The software then uses these points to ‘stretch’ the scanned map to make the new image sit neatly on top of the first one. This automated process only takes us so far, however, as shown in the image below.

The 2010 after the second order polynomial transform
To get the digitized map features to fit more closely with the underlying image requires some manual onscreen editing of the vectors, that is, the individual various polygons, lines and points that together comprise the map’s different feature layers. An example of this essential, but rather repetitive editing work required, is shown here.

Orkney on the Gough Map, the 2005 coastline vector is in blue and the edited coastline based upon the 2010 scan in red – note the second ‘ghost’ coastline visible on the 2010 scan.
The gain by having the new scan of the map was, in the shorter term, somewhat tempered by having to undertake this additional and unanticipated digitization work, therefore. The ultimate advantage of all this, however, was to have not just a high-quality map image available online but also the capability to allow users of the online map the option of looking at the Gough Map’s cartographic features separately from each other (and also independently of the map image), so making it possible to examine and visualise, for example, the patterns of rivers or routes that are shown by the Gough Map. The various feature layers evident on the Gough Map are shown here:

The full extent of the digitized feature layers of the Gough Map based upon the 2010 scan
As well as editing of the shapefiles, further editing work was undertaken within the tables of information comprising the attribute data that is linked within the GIS to the mapped features. These attribute data were important in creating our online Gough Map, though at the same time they also presented technical challenges, in marrying up the GIS data with the image and textual components of the web-resource, for example. (Some aspects of this process are explored in the interpretative essay by Paul Vetch on ‘Technical Production’). One of the unexpected outcomes of this re-digitization work is that it is has allowed detailed quantitative analysis comparing the vector data derived from the two map-scans (of 2005 and 2010), the results of which are proving useful in demonstrating a technique for measuring and testing whether changes occur in manuscript maps over periods of time, itself a useful by product of our study that has clear potential for those involved with the conservation of manuscript sources, whether images or texts.

A screenshot of the finalised vector layers and the attribute data on the Gough Map
- [1] For details of the digitization work undertaken in 2005, see K.D. Lilley and C.D. Lloyd, ‘Mapping the realm: a new look at the Gough Map of Britain (c.1360)’, Imago Mundi 61(1) (2009), 1-28; C.D. Lloyd and K.D. Lilley ‘Cartographic veracity in medieval mapping: analyzing geographical variation in the Gough Map of Great Britain’, Annals of the Association of American Geographers 99(1) (2009), 27-48.
↩